(2024) Climate Data Sculpture
Environmental data, LED lights, screen, resin, and custom software
pyr [πῦρ] meaning fire
anthos [ἄνθος] meaning flower
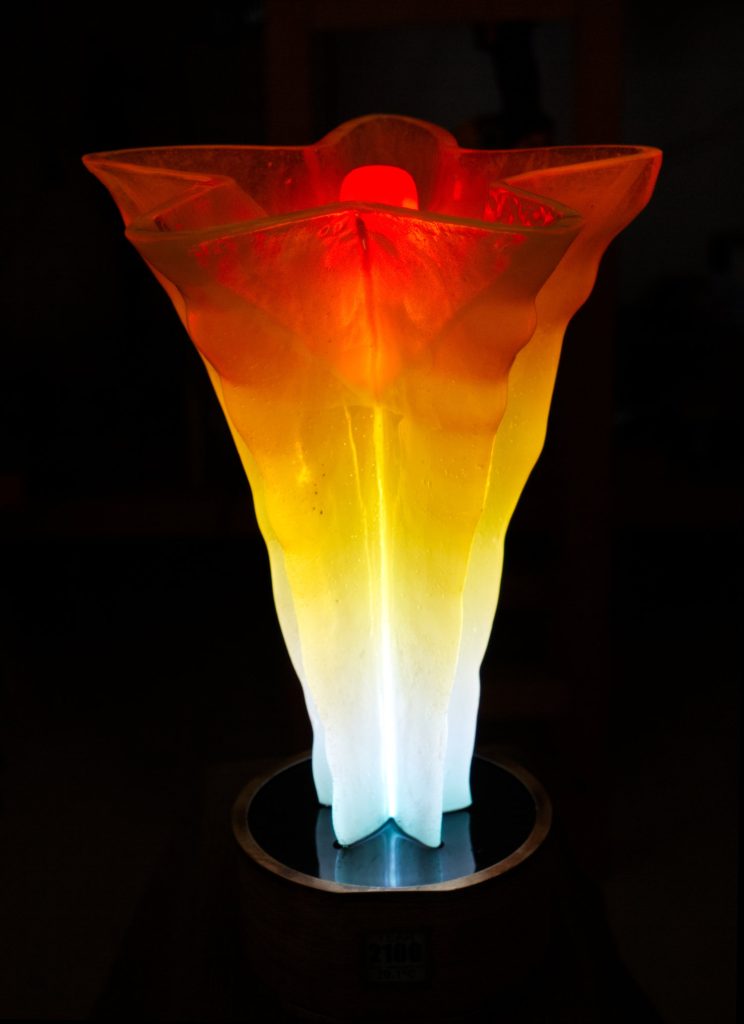
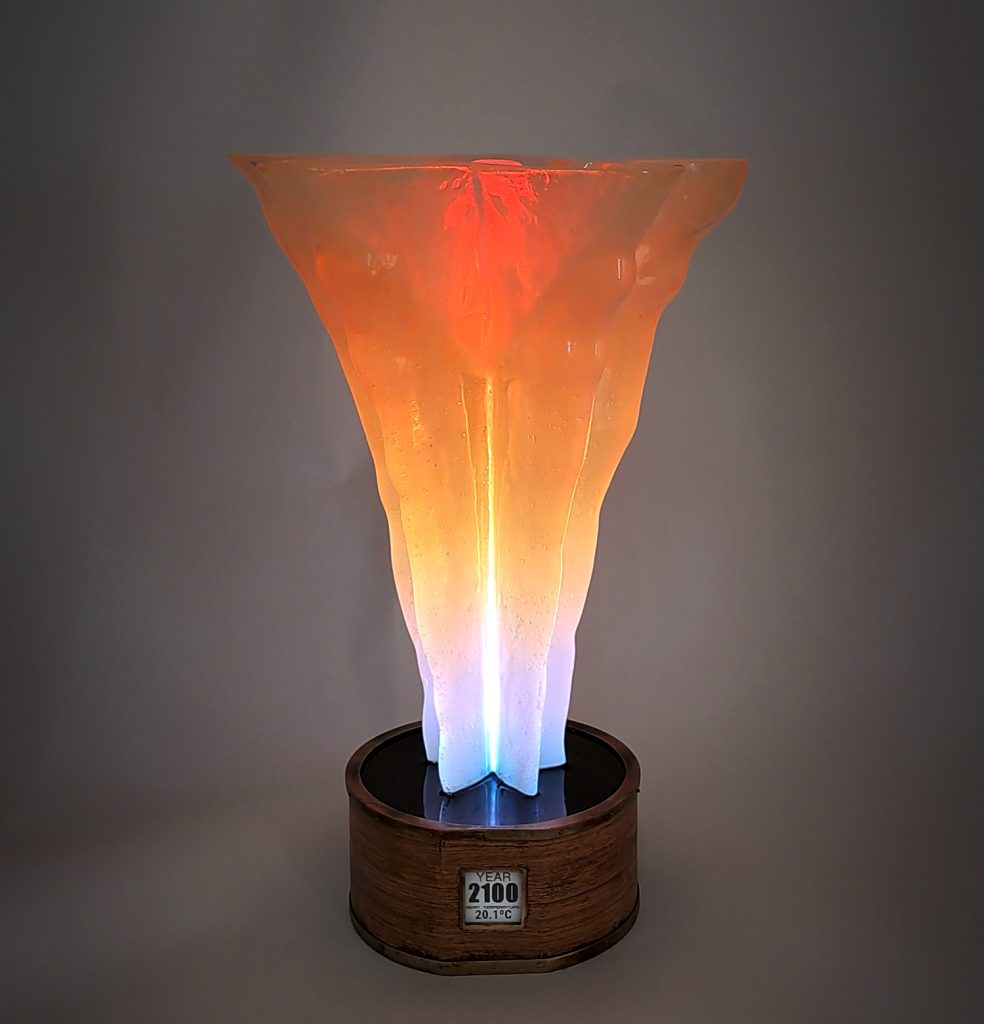
Pyranthos is a climate data sculpture created by the historical and projected temperature data from 1950 to 2100, visualizing the temperature shift over 150 years and telling the story of our warming planet. The sculpture features a base with a screen displaying years and corresponding temperature data, while a light line along the central z-axis lights up in a gradient. The colors transition from cyan at the base, representing cooler temperatures, to orange and red at the top, symbolizing the rising temperatures over time.
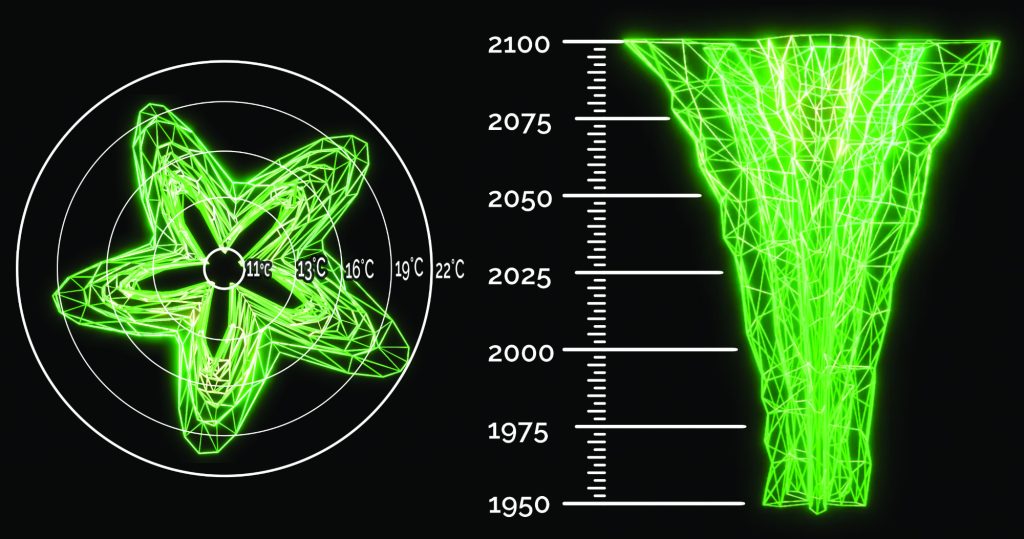
Pyranthos was created by mapping temperature data onto a polar coordinate system. Higher temperatures are represented by points farther from the center. The z-axis represents time, with each year corresponding to a specific elevation.
Data: Air Temperature from 1950 to 2100
Source: Iturbide, M., Fernández, J., Gutiérrez, J.M., Bedia, J., Cimadevilla, E., Díez-Sierra, J., Manzanas, R., Casanueva, A., Baño-Medina, J., Milovac, J., Herrera, S., Cofiño, A.S., San Martín, D., García-Díez, M., Hauser, M., Huard, D., Yelekci, Ö. (2021) Repository supporting the implementation of FAIR principles in the IPCC-WG1 Atlas. Zenodo, DOI: 10.5281/zenodo.3691645. Available from: https://github.com/IPCC-WG1/Atlas
Photos