(2017) Data driven kinetic light & sound sculpture.
Acrylic, LEDs, solar wind data, raspberry Pi, screen, arduino, motor, speakers & custom software.
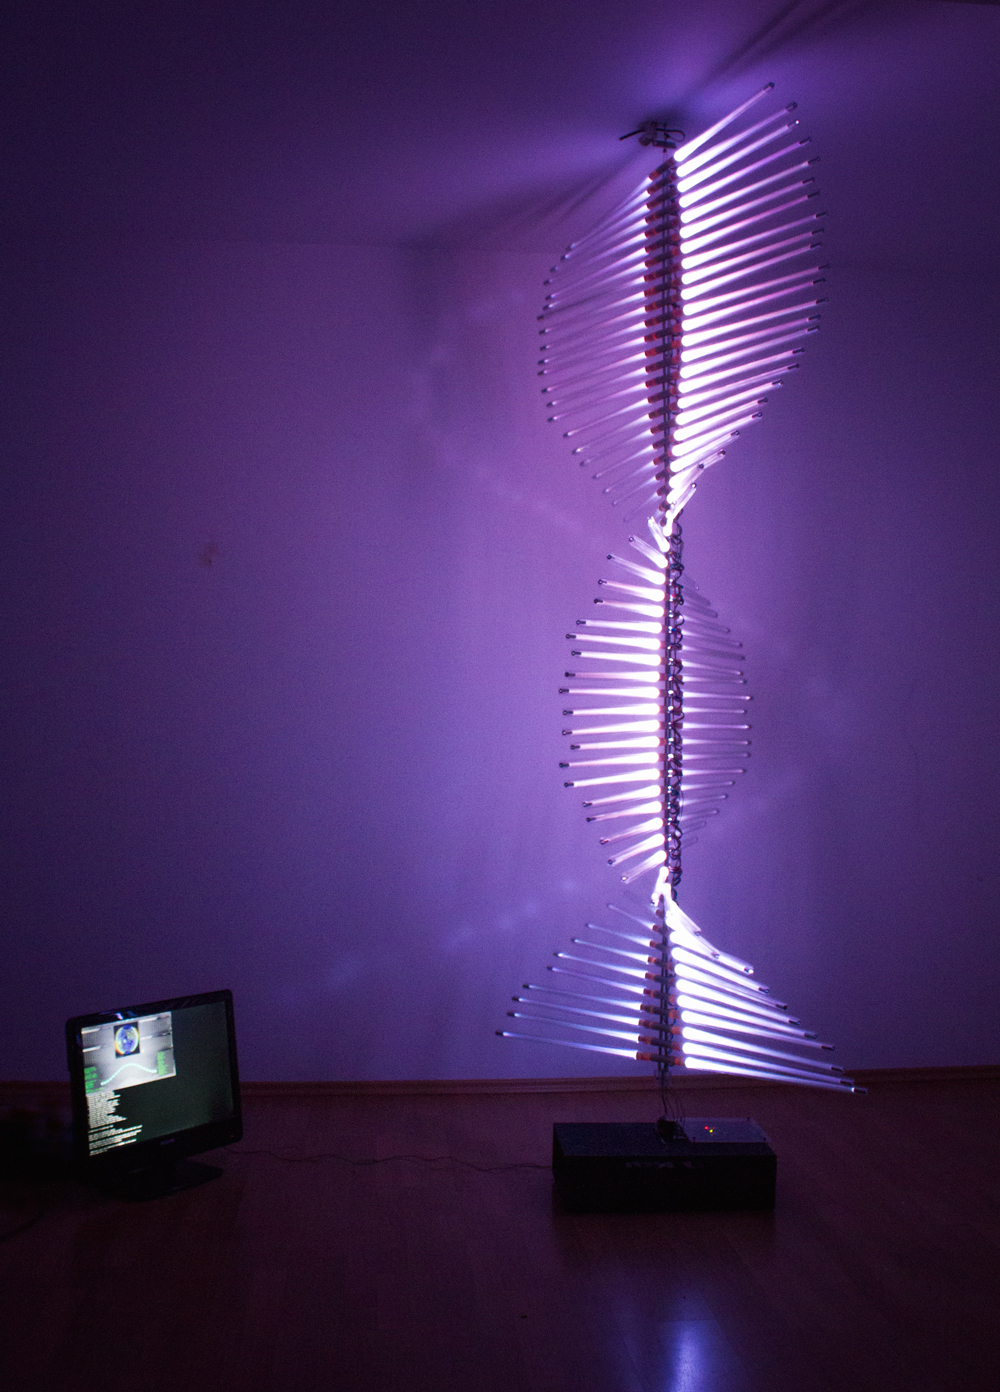
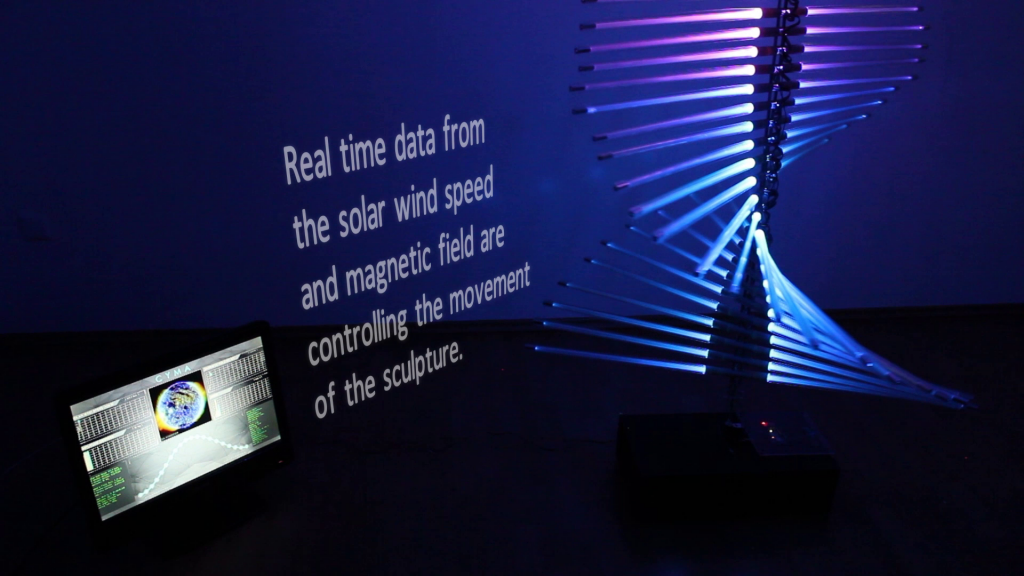
“Cyma {Fos}” (from Greek: κῦμα, meaning “wave” and φως meaning “light”) is a real time data driven kinetic light and sound sculpture highly inspired by natural repeatability and wave movement. An array of light acrylic bars, connected only with a metal wire passed from the center, is hanged from the ceiling and reaches the floor. The bottom bar is rotating periodically and sets the whole sculpture in motion. The motion of the bottom bar is creating a wave that physically spreads from one bar to the other. Real time data of the solar wind are defining the motion of the wave. The whole sculpture is waving without any mechanical force (except from the bottom bar), in the natural fundamental frequency and in higher modes called harmonics in a hypnotic and mesmerizing way.
The movement of the sculpture is driven in real time by live data of the solar wind. The strength of the wave movement (amplitude of the modulation) is controlled by the solar wind speed and the mode of waves (fundamental or harmonics) is controlled by north-south direction of the interplanetary magnetic field (Bz). A screen placed near the sculpture, projects the data and movement visualization.
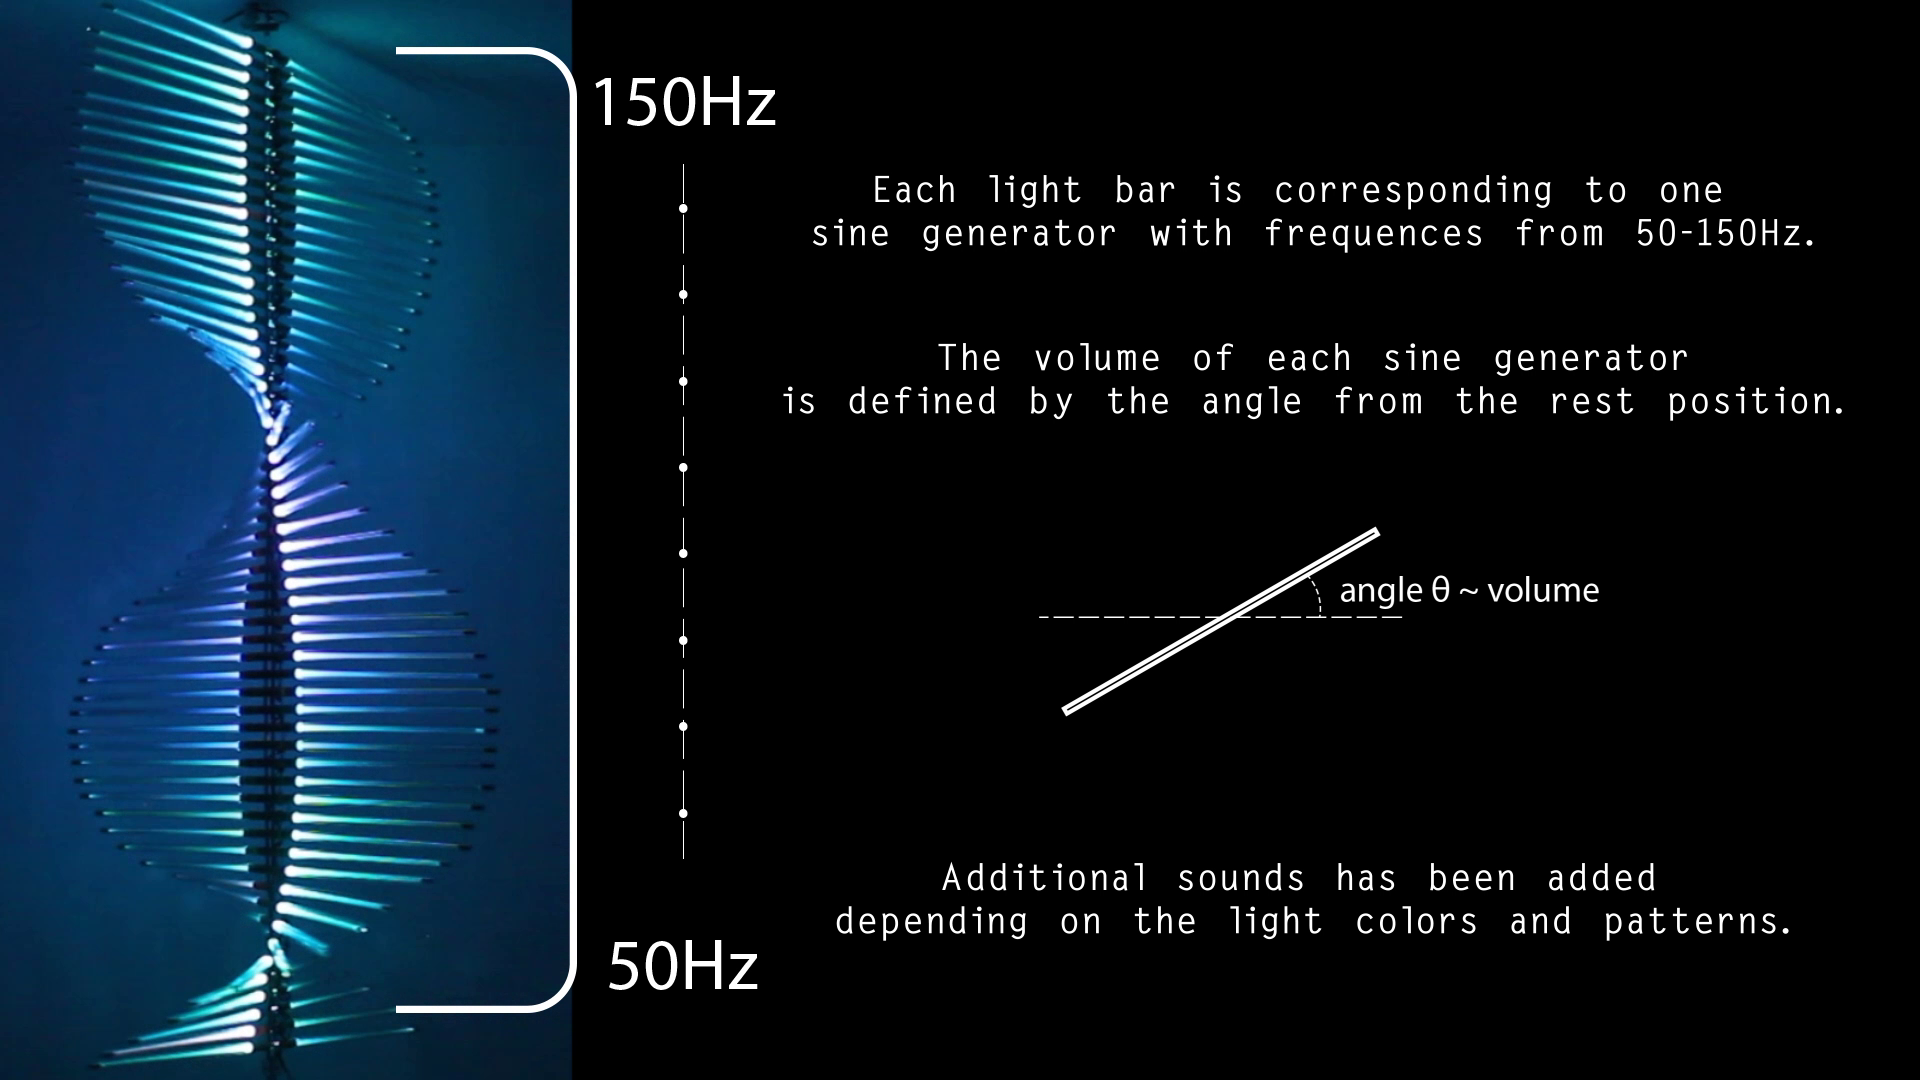
While the sculpture is moving, the horizontal bars light up in various colors. The position, speed, amplitude and other properties of the wave motion are affecting the light patterns of the sculpture. At the same time the sound is following a similar approach. There are 58 sin audio oscillators, each for every light bar, with different frequencies (from 50 to 150 Hz). The position of each bar is changing the volume of the oscillator. Additional sounds have been added to the final soundscape.
Festivals & Exhibitions:
• Sonar 2019, Athens, Greece (October 11, 2019)
• International Symposium on Electronic Arts 2019, Gwangsan-dong, South Korea (June 22, 2019)
• Athens International Airport “Eleftherios Venizelos”, Spata, Greece (December 07, 2018)
• Athens Digital Arts Festival 2018, Athens , Greece (May 24, 2018)


View this post on Instagram
About the Data
The Deep Space Climate Observatory (DSCOVR) mission is now the primary source for real-time solar wind and interplanetary magnetic field data but there is one more satellite at the Sun-Earth L1 point that measures the incoming solar wind and and that is the Advanced Composition Explorer. This satellite used to be the primary real-time space weather data source up until July 2016 when DSCOVR become fully operational.
The Solar Wind
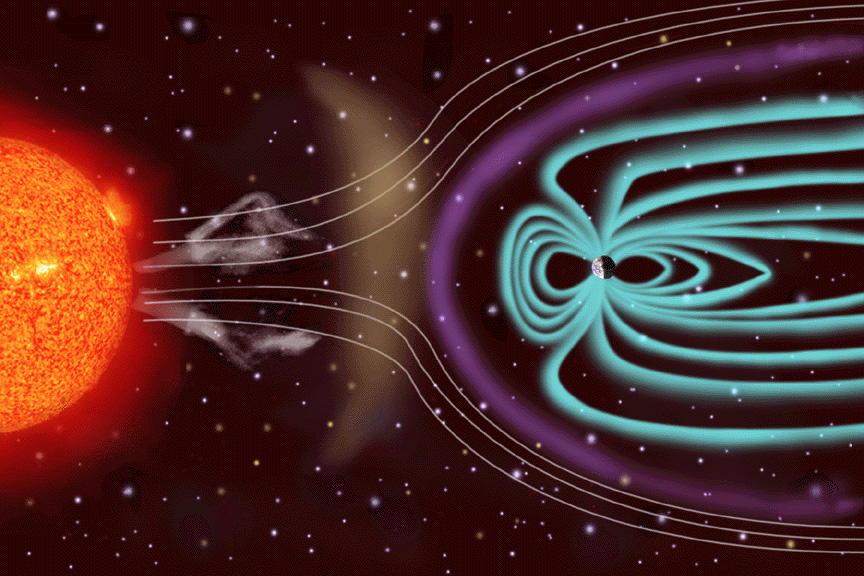
The solar wind is a stream of charged particles (a plasma) released from the Sun. This stream constantly varies in speed, density and temperature. The most dramatic difference in these three parameters occur when the solar wind escapes from a coronal hole or as a coronal mass ejection. When these solar wind structures arrive at Earth they encounter Earth’s magnetic field where solar wind particles are able to enter our atmosphere around our planet’s magnetic north and south pole. The solar wind particles collide there with the atoms that make up our atmosphere like nitrogen and oxygen atoms which in turn gives them energy which they slowly release as light. The speed of the solar wind is an important factor. Particles with a higher speed hit Earth’s magnetosphere harder and have a higher chance of causing disturbed geomagnetic conditions as they compress the magnetosphere. (https://www.spaceweatherlive.com/en/help/the-solar-wind)
The Interplanetary Magnetic Field (IMF)
The interplanetary magnetic field (IMF) plays a huge rule in how the solar wind interacts with Earth’s magnetosphere.
The Sun’s magnetic field
During solar minimum, the magnetic field of the Sun looks similar to Earth’s magnetic field. It looks a bit like an ordinary bar magnet with closed lines close to the equator and open field lines near the poles. Scientist call those areas a dipole. The dipole field of the Sun is about as strong as a magnet on a refrigerator (around 50 gauss). The magnetic field of the Earth is about 100 times weaker.
Around solar maximum, when the sun reaches her maximum activity, many sunspots are visible on the visible solar disk. These sunspots are filled with magnetism and large magnetic field lines which run material along them. These field lines are often hundreds of times stronger than the surrounding dipole. This causes the magnetic field around the Sun to be a very complex magnetic field with many disturbed field lines.
The magnetic field of our Sun doesn’t stay around the Sun itself. The solar wind carries it through the Solar System until it reaches the heliopause. The heliopause is the place where the solar wind comes to a stop and where it collides with the interstellar medium. Because the Sun turns around her axis (once in about 25 days) the interplanetary magnetic field has a spiral shape which is called the Parker Spiral.
Bt value
The Bt value of the interplanetary magnetic field indicates the total strength of the interplanetary magnetic field. The higher this value, the better it is for enhanced geomagnetic conditions. Moderate Interplanetary Magnetic Field strength values start at 15nT but for middle latitude locations, values of 25nT or more are desirable.
(https://www.spaceweatherlive.com/en/help/the-interplanetary-magnetic-field-imf)
The Aurora
Auroras are produced when the magnetosphere is sufficiently disturbed by the solar wind that the trajectories of charged particles in both solar wind and magnetospheric plasma, mainly in the form of electrons and protons, precipitate them into the upper atmosphere, where their energy is lost. The resulting ionization and excitation of atmospheric constituents emits light of varying color and complexity (https://en.wikipedia.org/wiki/Aurora).