24 custom metronomes, environmental data, LED lights, visualizations, and custom software.
Scientific Collaborator: Frank Dentener (European Comission, Joint Research Center)

“The Tipping Point” is commissioned by the European Commission’s Joint Research Centre as part of the SciArt Resonances IV program.
Exhibitions:
• 21st Athens Digital Arts Festival, Technopolis – Athens, Greece (April 03, 2025)
• NaturArchy, iMAL, Art Center for Digital Cultures & Technology – Koolmijnenkaai, Belgium (May 24, 2024)
The Tipping Point” is a data-driven light and sound kinetic installation of 24 custom metronomes and a video projection. The movement of the metronomes is driven by various environmental data connected with the five major climate tipping points. The artwork highlights the urgency and the increased risk that one or several tipping elements in the climate system might cross a critical threshold, resulting in severe consequences for the global climate, ecosystems, and human societies. The title “The Tipping Point” does not refer solely to climate tipping points but also to the social tipping point we are approaching. It emphasizes the need for collective action, demanding governments and corporations to change their policies and business practices. As Robert Swan aptly stated, “The greatest threat to our planet is the belief that someone else will save it.”
The installation runs in five different thematic circles. Each circle focuses on a different climate tipping point, and the data that is used to drive the metronomes relates to with either the cause or the effect of the particular climate change.
The datasets utilized in the installation encompass data from the early 20th century to the present day, extending even into the future through projection models. Embarking on a temporal journey from the past to the present and onward to the future, the installation dynamically mirrors this progression. The tempo of the metronomes’ beats synchronizes with the fluctuating values of the data, gradually intensifying over time. Initially tranquil, the soundscape evolves into a cacophony, reflecting the mounting urgency of the climate crisis. Abruptly, all metronomes halt, plunging the space into a deafening silence that signifies the critical tipping point that has been reached.
The artwork’s title, “The Tipping Point,” is singular rather than plural. It does not refer to climate tipping points, but to the tipping point that we are approaching as a society. Scientists have worked for years to persuade us of the urgency of the climate crisis and the need to act. We, the artists, are joining forces with the scientists, using different means to make this message even stronger. My aspiration is for the visitors to the installation to realize that now is the time to take collective action, pressuring governments and corporations to change their policies and business practices. As Robert Swan said, “The greatest threat to our planet is the belief that someone else will save it.”
The 9 Climate Tipping Points
UN Secretary-General Antonio Guterres recently said, “…time is running out. Irreversible climate tipping points lie alarmingly close.”
A climate tipping point is a critical threshold in the Earth’s climate system where a relatively small change can lead to significant and often irreversible consequences. At these points, the climate system undergoes a rapid and sometimes abrupt shift to a new state, often triggering cascading effects that can impact ecosystems, weather patterns, and human societies. Examples of climate tipping points include the collapse of ice sheets, disruption of ocean currents, and release of large amounts of greenhouse gases from thawing permafrost. Once a tipping point is crossed, it can be challenging or impossible to return to the previous state, making them a significant concern in climate change research and policy. The concept of tipping points was introduced by the IPCC 20 years ago, but then it was thought they would only occur if global warming reached 5°C. Recent IPCC assessments, however, suggested that tipping points could be reached between 1°C and 2°C of warming.
Nine major tipping points have been identified, each representing a potential trigger for cascading environmental effects. Among these tipping points is the disruption of the Atlantic Meridional Overturning Circulation (AMOC), a crucial ocean current system that regulates global climate patterns. The disintegration of the West Antarctic Ice Sheet looms as another significant tipping point, with the potential to unleash massive sea level rise and alter coastlines worldwide. The Amazon rainforest, often referred to as the “lungs of the Earth,” faces the threat of irreversible dieback due to deforestation and climate change-induced stress. Shifts in monsoon patterns in regions like West Africa and India could disrupt agricultural systems and water availability, exacerbating food insecurity and ecological imbalance. Thawing permafrost, releasing methane—a potent greenhouse gas—poses a significant risk to exacerbating global warming. Coral reef die-off, driven by warming ocean temperatures, threatens marine biodiversity and the livelihoods of coastal communities. The melting of the Greenland Ice Sheet adds to concerns about rising sea levels, while changes in boreal forest distribution could impact carbon storage and ecosystem dynamics. Collectively, these nine tipping points underscore the urgent need for proactive measures to mitigate climate change and protect the stability of Earth’s interconnected systems.
The Five Thematic Circles
The Ice

“We’d rather have the iceberg than the ship,
― Elizabeth Bishop, The Imaginary Iceberg
although it meant the end of travel.
Although it stood stock-still like cloudy
rock and all the sea were moving marble.
We’d rather have the iceberg than the ship;
we’d rather own this breathing plain of snow
though the ship’s sails were laid upon the sea
as the snow lies undissolved upon the water.
O solemn, floating field,
are you aware an iceberg takes repose
with you, and when it wakes may pasture on your snows?”
Over the past few decades, the acceleration of ice melt in the Arctic Sea, Greenland, West Antarctica, and East Antarctica has been increasingly evident, largely attributed to human activities, notably the emission of carbon dioxide and other greenhouse gases, with implications for sea levels and global stability contingent upon the evolution of these substantial ice masses.
Data: Air Temperature from 1950 to 2100
Source: Iturbide, M., Fernández, J., Gutiérrez, J.M., Bedia, J., Cimadevilla, E., Díez-Sierra, J., Manzanas, R., Casanueva, A., Baño-Medina, J., Milovac, J., Herrera, S., Cofiño, A.S., San Martín, D., García-Díez, M., Hauser, M., Huard, D., Yelekci, Ö. (2021) Repository supporting the implementation of FAIR principles in the IPCC-WG1 Atlas. Zenodo, DOI: 10.5281/zenodo.3691645. Available from: https://github.com/IPCC-WG1/Atlas
The Thermohaline Circulation

“Thus this mysterious, divine Pacific zones the world’s whole bulk about;
― Herman Melville, Moby-Dick or, the Whale
makes all coasts one bay to it;
seems the tide-beating heart of earth.
Lifted by those eternal swells,
you needs must own the seductive god, bowing your head to Pan.”
Thermohaline circulation is a part of the large-scale ocean circulation that is driven by global density gradients created by surface heat and freshwater fluxes. The water in these circuits transport both heat and dissolved solids and gases around the globe. The thermohaline circulation plays an important role in supplying heat to the polar regions. Changes in the thermohaline circulation are thought to have significant impacts on Earth’s climate. Since 1950, a 15% slowdown has been observed.
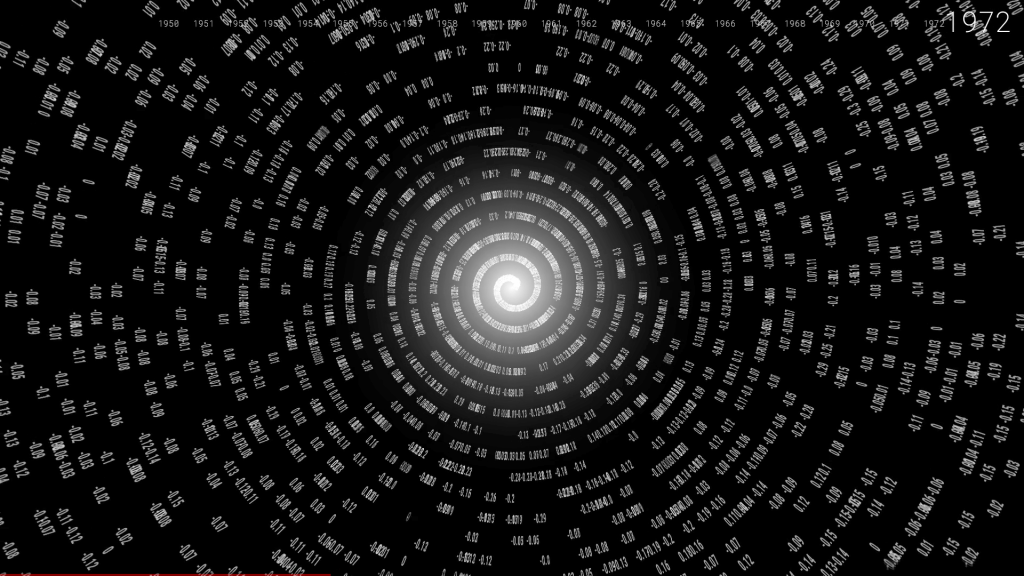
Data: Ocean Salinity Change from 1950 to 2019
Soure: IPCC, 2021: Chapter 2. In: Climate Change 2021: The Physical Science Basis. Contribution of Working Group I to the Sixth Assessment Report of the Intergovernmental Panel on Climate Change [Gulev, S.K., P.W. Thorne, J. Ahn, F.J. Dentener, C.M. Domingues, S. Gerland, D. Gong, D.S. Kaufman, H.C. Nnamchi, J. Quaas, J.A. Rivera, S. Sathyendranath, S.L. Smith, B. Trewin, K. von Schuckmann, and R.S. Vose, 2021: Changing State of the Climate System. In Climate Change 2021: The Physical Science Basis. Contribution of Working Group I to the Sixth Assessment Report of the Intergovernmental Panel on Climate Change [Masson-Delmotte, V., P. Zhai, A. Pirani, S.L. Connors, C. Péan, S. Berger, N. Caud, Y. Chen, L. Goldfarb, M.I. Gomis, M. Huang, K. Leitzell, E. Lonnoy, J.B.R. Matthews, T.K. Maycock, T. Waterfield, O. Yelekçi, R. Yu, and B. Zhou (eds.)]. Cambridge University Press, Cambridge, United Kingdom and New York, NY, USA, pp. 287–422, doi: 10.1017/9781009157896.004 .]
The Corals

“So we sailed on through the narrow straits, crying aloud for fear of Scylla on the one hand
― Homer, The Odyssey, Book XII:235-245
while divine Charybdis sucked the sea in terribly on the other.
Whenever she spewed it out again,it bubbled and seethed in turmoil like a cauldron on a vast fire,
and high overhead the spray rained down on the crags on either side. When she swallowed the seas,
her inner vortex could be seen, and the rock echoed savagely round about,
while below the seabed showed its dark-blue sand.
My crew turned pale as we gazed at her, fearing destruction,
but even as we did so Scylla seized six of my strongest and ablest men from the deck.”
Corals are under stress from climate change, declining water quality, overfishing, pollution and unsustainable coastal development. Corals provide the basis for functioning coral reefs, which are some of the planet’s most biologically diverse and valuable ecosystems. They provide a home to a quarter of marine species—including a unique set of fish, turtles and algae. With temperatures only expected to rise in the coming decades, many of these species could be lost permanently.
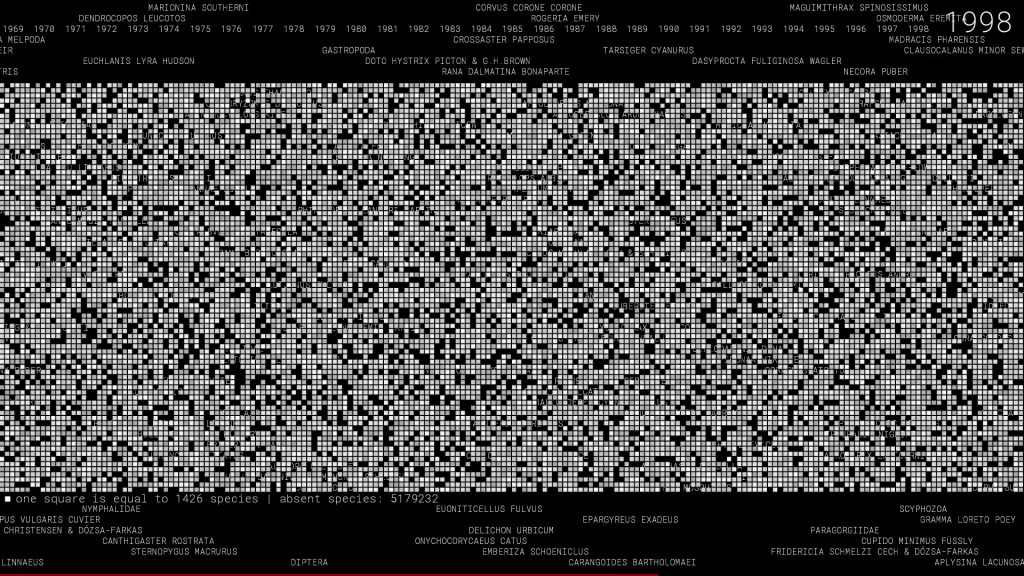
Data I: Species Absence from 1900 to 2023
Source I: GBIF.org Occurrence, DOI: https://doi.org/10.15468/dl.vcqrwe, Creation Date: 06:30:57 13 September 2023, Records included: 27451015 records from 1813 published datasets.
Data II: Sea Surface Temperature Change at South Pacific Ocean from 1950 to 2100
Source II: Iturbide, M., Fernández, J., Gutiérrez, J.M., Bedia, J., Cimadevilla, E., Díez-Sierra, J., Manzanas, R., Casanueva, A., Baño-Medina, J., Milovac, J., Herrera, S., Cofiño, A.S., San Martín, D., García-Díez, M., Hauser, M., Huard, D., Yelekci, Ö. (2021). Repository supporting the implementation of FAIR principles in the IPCC-WG1 Atlas. Zenodo, DOI: 10.5281/zenodo.3691645. Available from: https://github.com/IPCC-WG1/Atlas
The Permafrost

“…we walk to the river brother and I
― Duncan Mercredi , Misipawistik
the moon slips behind the clouds
the northern lights fade into darkness
I look up the stars make my head spin
piyatuck jo-jo says
piyatuck
I follow his tracks
dogs quieten
the wolf has become silent
I look around and all around me the houses darken
all I hear are the soft footstep sounds we make
footsteps only you can make when you wear moccasins”
Permafrost refers to soil that remains consistently frozen, staying below 0°C for extended periods, with some instances lasting up to 700,000 years. However, as global temperatures rise, permafrost begins to thaw, releasing previously trapped carbon that converts into greenhouse gases like carbon dioxide and methane. This process creates a feedback loop, where the released carbon contributes to further warming, exacerbating permafrost thawing. Consequently, permafrost thawing is an example of positive climate change feedback and represents one of the pivotal tipping points within the climate system.

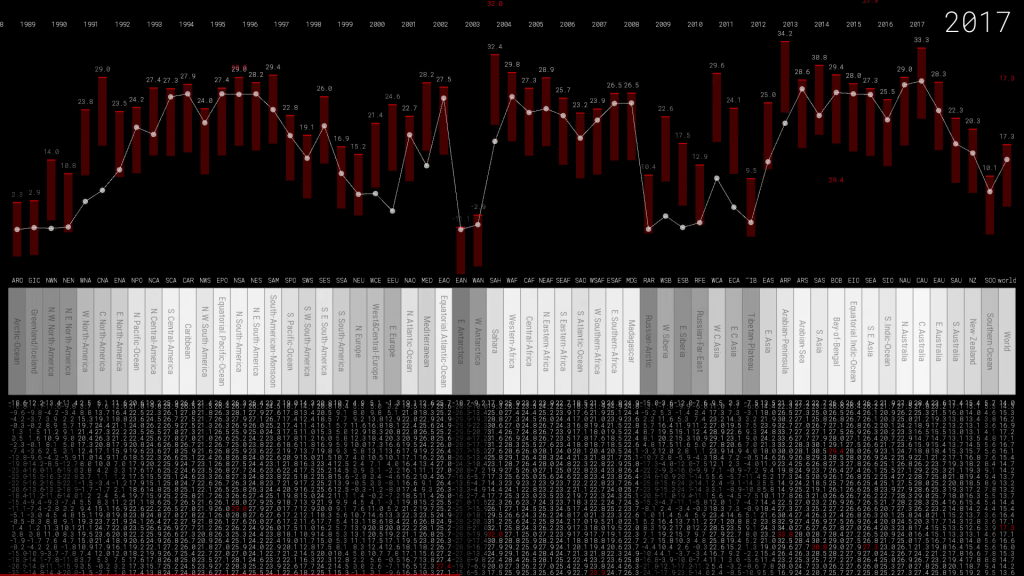
Data: Changes in Permafrost Temperature from 1974 to 2019
Source: Figure 2.25 in IPCC, 2021: Chapter 2. In: Climate Change 2021: The Physical Science Basis. Contribution of Working Group I to the Sixth Assessment Report of the Intergovernmental Panel on Climate Change. [Gulev, S.K., P.W. Thorne, J. Ahn, F.J. Dentener, C.M. Domingues, S. Gerland, D. Gong, D.S. Kaufman, H.C. Nnamchi, J. Quaas, J.A. Rivera, S. Sathyendranath, S.L. Smith, B. Trewin, K. von Schuckmann, and R.S. Vose, 2021: Changing State of the Climate System. In Climate Change 2021: The Physical Science Basis. Contribution of Working Group I to the Sixth Assessment Report of the Intergovernmental Panel on Climate Change [Masson-Delmotte, V., P. Zhai, A. Pirani, S.L. Connors, C. Péan, S. Berger, N. Caud, Y. Chen, L. Goldfarb, M.I. Gomis, M. Huang, K. Leitzell, E. Lonnoy, J.B.R. Matthews, T.K. Maycock, T. Waterfield, O. Yelekçi, R. Yu, and B. Zhou (eds.)]. Cambridge University Press, Cambridge, United Kingdom and New York, NY, USA, pp. 287–422, doi: 10.1017/9781009157896.004 .]
The Forest

An old silent pond…
― Matsuo Bashô, Frog Haiku
A frog jumps into the pond,
splash!
Deforestation stands as a significant driver of climate change, commonly acknowledged as a primary factor contributing to the exacerbation of the greenhouse effect. Recent estimates indicate that carbon dioxide (CO2) emissions resulting from deforestation and forest degradation account for approximately 12% of total anthropogenic CO2 emissions. Deforestation not only impacts climate change but also leads to biodiversity loss and decreased rainfall. The removal of forests disrupts ecosystems, leading to the loss of habitat for countless plant and animal species.

Data: Accumulated Deforested Area in Amazon from 1987 to 2020
Source: MapBiomas Project- Collection of the Annual Series of Land Use and Land Cover Maps of Brazil. Souza at. al. (2020)– Reconstructing Three Decades of Land Use and Land Cover Changes in Brazilian Biomes with Landsat Archive and Earth Engine – Remote Sensing, Volume 12, Issue 17, 10.3390/rs12172735.
Technical Framework
For this installation, 24 custom metronomes were purposefully designed and created to align with the conceptual vision of the artwork. The process involved careful consideration of not only the aesthetic qualities but also the functional aspects, such as how the metronomes would interact with the central computer and with the surrounding environment.

The integration of light and sound is a central feature of the metronomes, serving to enhance the immersive experience for viewers. Through the fusion of these elements, a rich and multidimensional soundscape is created, one that evolves dynamically as the installation progresses. The synchronized pulsation of light and rhythmical beats of sound from each metronome contribute to the overall ambiance, captivating the senses and drawing viewers deeper into the artwork.
The 24 custom metronomes serve not only as artistic elements within the installation but also as conduits for conveying the themes and messages inherent in the artwork. Through their collective presence and orchestrated performance, they invite viewers to engage with the piece on multiple levels, fostering contemplation, reflection, and perhaps even action in response to the urgent issues explored.
The sound from each metronome is just a simple “tick,” purposely designed to resemble the sound of a Geiger counter, the device used to detect radiation. As more and more metronomes start ticking fast, the overall soundscape resembles the alarming sound of a Geiger counter approaching a dangerous radioactive space.
Left: An inside view of the metronome’s electronics. Right: Testing phase for the 24 metronomes.
All metronomes are linked and communicate with a central computer, which provides data and controls the visualizations that are projected into the wall.
Statement by Frank Dentener (Scientific Collaborator)
Tipping points refer to critical threshold beyond which a system reorganizes, often abruptly and/or irreversibly. Well documented examples of tipping points are the abrupt changes from interglacial to glacial (“ice-age”) which during the last million year took place about 10 times, happened in the course of a few hundred years, and then lasted 10 thousands of years. As they happen so seldom the mechanism and probability of tipping points to happen are very uncertain, but the consequences could be widespread. Currently identified tipping elements in the earth’s climate system are boreal and Amazon forest dieback, melting of the Greenland ice sheet and arctic sea-ice loss, instability of the Antarctic ice sheets, permafrost melting, change in ocean circulations (North Atlantic/Pacific), and changes in Monsoon circulation in Africa and Asia.
View this post on Instagram